大水文罢了。😁😁😁😁😅
Series 操作
Series 创建
1 2 t=pd.Series([1 ,2 ,3 ,4 ,5 ]) t
0    1
1    2
2    3
3    4
4    5
dtype: int64
1 2 t2=pd.Series([1 ,2 ,3 ,4 ,5 ],index=['a' ,'b' ,'c' ,'d' ,'e' ]) t2
a    1
b    2
c    3
d    4
e    5
dtype: int64
1 2 3 4 5 6 temp_dict={"name" :"wangsheng" , "age" :100 , "tel" :10086 } t3=pd.Series(temp_dict) t3
name    wangsheng
age           100
tel         10086
dtype: object
Series 切片和索引
name    wangsheng
age           100
tel         10086
dtype: object
100
10086
wangsheng
10086
name wangsheng
age 100
dtype: object
age 100
tel 10086
dtype: object
age 100
tel 10086
dtype: object
0 1
1
2
2 3
3    4
4    5
dtype: int64
3 4
4 5
dtype: int64
Index(['name', 'age', 'tel'], dtype='object')
array(['wangsheng', 100, 10086], dtype=object)
读取外部数据
1 2 3 4 df=pd.read_csv("./dogNames2.csv" ) print (df.head())row=df["Row_Labels" ] print (row.shape)
  Row_Labels  Count_AnimalName
0          1                 1
1          2                 2
2      40804                 1
3      90201                 1
4      90203                 1
(16220,)
DataFrame
1
2
import numpy as nppd.DataFrame(np.arange(12 ).reshape((3 ,-1 )))
0
1
2
3
0
0
1
2
3
1
4
5
6
7
2
8
9
10
11
DataFrame对象既有行索引,又有列索引
列索引,表名不同列,纵向索引,叫columns,1轴,axis=1
1 pd.DataFrame(np.arange(12 ).reshape((3 ,-1 )),index=['a' ,'b' ,'c' ],columns=['A' ,'B' ,'C' ,'D' ])
A
B
C
D
a
0
1
2
3
b
4
5
6
7
c
8
9
10
11
1.DataFrame和Series有什么关系呢?
2.Series能够传入字典,那么DataFrame能够传入字典作为数据么?那么mongodb的数据是不是也可以这样传入呢?
1 2 3 4 d1={"name" :["xiaoming" ,"xiaogang" ], "age" :[28 ,19 ], "tel" :[10086 ,10010 ]} pd.DataFrame(d1)
name
age
tel
0
xiaoming
28
10086
1
xiaogang
19
10010
1 2 3 4 5 d2=[{"name" :"xiaoming" ,"age" :32 ,"tel" :10086 }, {"name" :"xiaogang" ,"tel" :78 }, {"name" :"ss" ,"age" :10 }] a=pd.DataFrame(d2) a
name
age
tel
0
xiaoming
32.0
10086.0
1
xiaogang
NaN
78.0
2
ss
10.0
NaN
DataFrame属性
属性
含义
df.shape
行数,列数
df.dtypes
列数据类型
df.ndim
数据维度
df.index
行索引
df.columns
列索引
df.values
对象值,是二维ndarray数组
DataFrame整体情况查询
函数
作用
df.head(3)
显示头部几行,默认五行
df.tail(2)
显示尾部几行,默认5行
df.info ()相关信息概述:行数,列数,列索引,列非空值个数,列类型,行类型,内存占用
df.describe()
快速综合统计结果:计数,均值,标准差,最大值,四分位数,最小值
1 2 df=pd.read_csv("./dogNames2.csv" ) df.head()
Row_Labels
Count_AnimalName
0
1
1
1
2
2
2
40804
1
3
90201
1
4
90203
1
Count_AnimalName
count
16220.000000
mean
6.558631
std
31.862511
min
1.000000
25%
1.000000
50%
1.000000
75%
3.000000
max
1195.000000
<class 'pandas.core.frame.DataFrame'>
RangeIndex: 16220 entries, 0 to 16219
Data columns (total 2 columns):
 #   Column            Non-Null Count  Dtype
---  ------            --------------  -----
 0   Row_Labels        16217 non-null  object
 1   Count_AnimalName  16220 non-null  int64
dtypes: int64(1), object(1)
memory usage: 253.6+ KB
1 2 3 df=df.sort_values(by="Count_AnimalName" ) df.head()
Row_Labels
Count_AnimalName
0
1
1
9383
MERINO
1
9384
MERISE
1
9386
MERLEDEZ
1
9389
MERLYN
1
1 2 df=df.sort_values(by="Count_AnimalName" ,ascending=False ) df.head()
Row_Labels
Count_AnimalName
1156
BELLA
1195
9140
MAX
1153
2660
CHARLIE
856
3251
COCO
852
12368
ROCKY
823
DataFrame取行或取列
Row_Labels
Count_AnimalName
1156
BELLA
1195
9140
MAX
1153
2660
CHARLIE
856
3251
COCO
852
12368
ROCKY
823
8417
LOLA
795
8552
LUCKY
723
8560
LUCY
710
2032
BUDDY
677
3641
DAISY
649
1 df["Count_AnimalName" ][:10 ]
1156     1195
9140     1153
2660      856
3251      852
12368     823
8417      795
8552      723
8560      710
2032      677
3641      649
Name: Count_AnimalName, dtype: int64
pandas取行或取列注意点:
loc索引
df.loc 通过标签索引行数据
1 2 t=pd.DataFrame(np.arange(12 ).reshape((3 ,-1 )),index=["a" ,'b' ,'c' ],columns=['W' ,'X' ,"Y" ,'Z' ]) t
W
X
Y
Z
a
0
1
2
3
b
4
5
6
7
c
8
9
10
11
W    0
X    1
Y    2
Z    3
Name: a, dtype: int32
3
1 t.loc[['a' ,'c' ],['W' ,'Z' ]]
W
X
Y
a
0
1
2
b
4
5
6
c
8
9
10
W    0
X    1
Y    2
Z    3
Name: a, dtype: int32
a     2
b     6
c    10
Name: Y, dtype: int32
W
X
Y
Z
a
0
1
2
3
b
4
5
6
7
W
X
Y
Z
a
0
1
100
3
b
4
5
6
7
c
8
9
10
11
bool索引
1 df[(df["Count_AnimalName" ]>800 )&(df["Count_AnimalName" ]<1000 )]
Row_Labels
Count_AnimalName
2660
CHARLIE
856
3251
COCO
852
12368
ROCKY
823
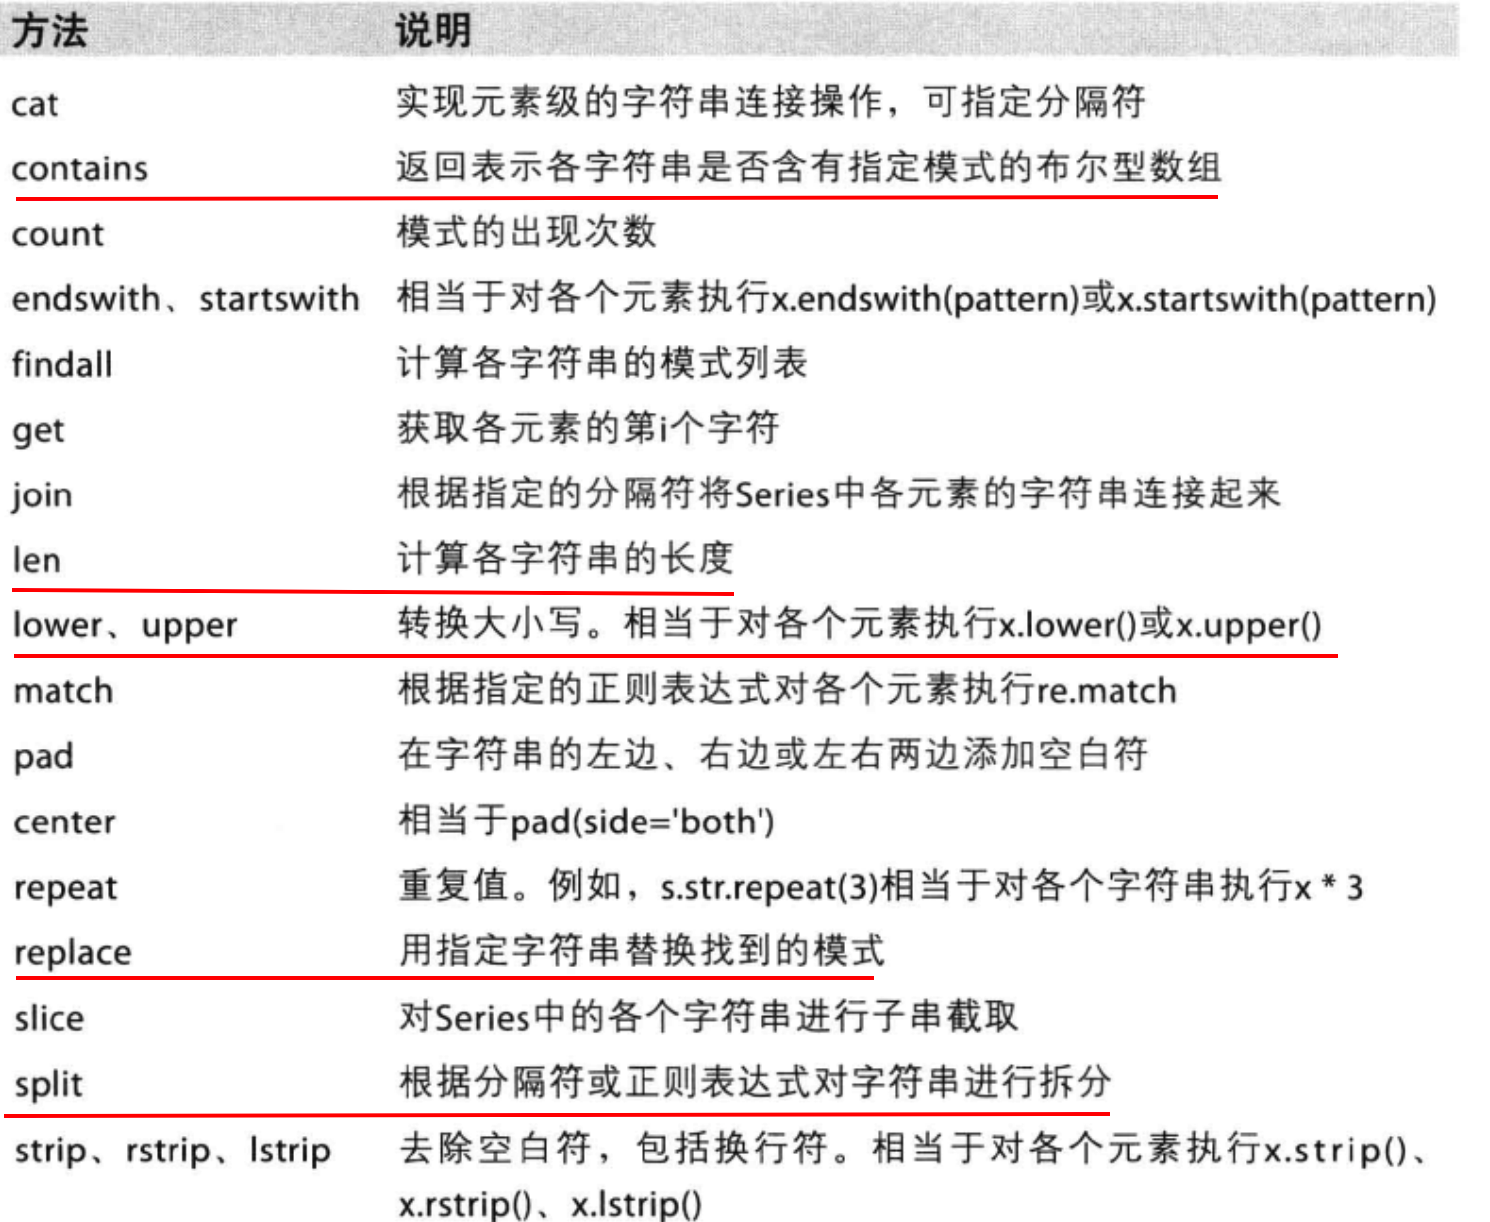
1 2 df[(df["Row_Labels" ].str .len ()>4 )&(df["Count_AnimalName" ]>800 )]
Row_Labels
Count_AnimalName
1156
BELLA
1195
2660
CHARLIE
856
12368
ROCKY
823
缺失数据处理
name
age
tel
0
xiaoming
32.0
10086.0
1
xiaogang
NaN
78.0
2
ss
10.0
NaN
name
age
tel
0
False
False
False
1
False
True
False
2
False
False
True
name
age
tel
0
True
True
True
1
True
False
True
2
True
True
False
处理方式1:删除NaN所在的行列dropna (axis=0, how=‘any’, inplace=False)
处理为0的数据:t[t==0]=np.nan
name
age
tel
0
xiaoming
32.0
10086.0
1 a.dropna(axis=0 ,how='all' )
name
age
tel
0
xiaoming
32.0
10086.0
1
xiaogang
NaN
78.0
2
ss
10.0
NaN
: FutureWarning: Dropping of nuisance columns in DataFrame reductions (with 'numeric_only=None') is deprecated; in a future version this will raise TypeError. Select only valid columns before calling the reduction.
a.fillna(a.mean())
name
age
tel
0
xiaoming
32.0
10086.0
1
xiaogang
21.0
78.0
2
ss
10.0
5082.0
1 2 a['age' ]=a['age' ].fillna(a["age" ].mean()) a
name
age
tel
0
xiaoming
32.0
10086.0
1
xiaogang
21.0
78.0
2
ss
10.0
NaN
pandas 数据合并与分组聚合
1 2 3 df=pd.read_csv("./IMDB-Movie-Data.csv" ) print (df.head(1 ))df.info()
Rank Title Genre \
0 1 Guardians of the Galaxy Action,Adventure,Sci-Fi
Description Director \
0 A group of intergalactic criminals are forced ... James Gunn
Actors Year Runtime (Minutes) \
0 Chris Pratt, Vin Diesel, Bradley Cooper, Zoe S... 2014 121
Rating Votes Revenue (Millions) Metascore
0 8.1 757074 333.13 76.0
<class 'pandas.core.frame.DataFrame'>
RangeIndex: 1000 entries, 0 to 999
Data columns (total 12 columns):
# Column Non-Null Count Dtype
--- ------ -------------- -----
0 Rank 1000 non-null int64
1 Title 1000 non-null object
2 Genre 1000 non-null object
3 Description 1000 non-null object
4 Director 1000 non-null object
5 Actors 1000 non-null object
6 Year 1000 non-null int64
7 Runtime (Minutes) 1000 non-null int64
8 Rating 1000 non-null float64
9 Votes 1000 non-null int64
10 Revenue (Millions) 872 non-null float64
11 Metascore 936 non-null float64
dtypes: float64(3), int64(4), object(5)
memory usage: 93.9+ KB
统计电影分类情况
1 2 3 temp_list=df["Genre" ].str .split("," ).tolist() print (temp_list[:5 ])
[['Action', 'Adventure', 'Sci-Fi'], ['Adventure', 'Mystery', 'Sci-Fi'], ['Horror', 'Thriller'], ['Animation', 'Comedy', 'Family'], ['Action', 'Adventure', 'Fantasy']]
1 2 genre_list=list (set ([i for j in temp_list for i in j])) print (genre_list)
['Horror', 'Animation', 'Action', 'Thriller', 'History', 'Adventure', 'Family', 'Mystery', 'War', 'Sport', 'Fantasy', 'Sci-Fi', 'Comedy', 'Crime', 'Biography', 'Music', 'Romance', 'Musical', 'Western', 'Drama']
1 2 3 zero_df=pd.DataFrame(np.zeros((df.shape[0 ],len (genre_list))),columns=genre_list) zero_df.head()
Horror
Animation
Action
Thriller
History
Adventure
Family
Mystery
War
Sport
Fantasy
Sci-Fi
Comedy
Crime
Biography
Music
Romance
Musical
Western
Drama
0
0.0
0.0
0.0
0.0
0.0
0.0
0.0
0.0
0.0
0.0
0.0
0.0
0.0
0.0
0.0
0.0
0.0
0.0
0.0
0.0
1
0.0
0.0
0.0
0.0
0.0
0.0
0.0
0.0
0.0
0.0
0.0
0.0
0.0
0.0
0.0
0.0
0.0
0.0
0.0
0.0
2
0.0
0.0
0.0
0.0
0.0
0.0
0.0
0.0
0.0
0.0
0.0
0.0
0.0
0.0
0.0
0.0
0.0
0.0
0.0
0.0
3
0.0
0.0
0.0
0.0
0.0
0.0
0.0
0.0
0.0
0.0
0.0
0.0
0.0
0.0
0.0
0.0
0.0
0.0
0.0
0.0
4
0.0
0.0
0.0
0.0
0.0
0.0
0.0
0.0
0.0
0.0
0.0
0.0
0.0
0.0
0.0
0.0
0.0
0.0
0.0
0.0
1 2 3 4 5 for i in range (df.shape[0 ]): zero_df.loc[i,temp_list[i]]=1 zero_df.head()
Horror
Animation
Action
Thriller
History
Adventure
Family
Mystery
War
Sport
Fantasy
Sci-Fi
Comedy
Crime
Biography
Music
Romance
Musical
Western
Drama
0
0.0
0.0
1.0
0.0
0.0
1.0
0.0
0.0
0.0
0.0
0.0
1.0
0.0
0.0
0.0
0.0
0.0
0.0
0.0
0.0
1
0.0
0.0
0.0
0.0
0.0
1.0
0.0
1.0
0.0
0.0
0.0
1.0
0.0
0.0
0.0
0.0
0.0
0.0
0.0
0.0
2
1.0
0.0
0.0
1.0
0.0
0.0
0.0
0.0
0.0
0.0
0.0
0.0
0.0
0.0
0.0
0.0
0.0
0.0
0.0
0.0
3
0.0
1.0
0.0
0.0
0.0
0.0
1.0
0.0
0.0
0.0
0.0
0.0
1.0
0.0
0.0
0.0
0.0
0.0
0.0
0.0
4
0.0
0.0
1.0
0.0
0.0
1.0
0.0
0.0
0.0
0.0
1.0
0.0
0.0
0.0
0.0
0.0
0.0
0.0
0.0
0.0
1 2 3 genre_count=zero_df.sum (axis=0 ) genre_count
Horror 119.0
Animation 49.0
Action 303.0
Thriller 195.0
History 29.0
Adventure 259.0
Family 51.0
Mystery 106.0
War 13.0
Sport 18.0
Fantasy 101.0
Sci-Fi 120.0
Comedy 279.0
Crime 150.0
Biography 81.0
Music 16.0
Romance 141.0
Musical 5.0
Western 7.0
Drama 513.0
dtype: float64
1 2 genre_count.sort_values()
Musical 5.0
Western 7.0
War 13.0
Music 16.0
Sport 18.0
History 29.0
Animation 49.0
Family 51.0
Biography 81.0
Fantasy 101.0
Mystery 106.0
Horror 119.0
Sci-Fi 120.0
Romance 141.0
Crime 150.0
Thriller 195.0
Adventure 259.0
Comedy 279.0
Action 303.0
Drama 513.0
dtype: float64
数组合并之join
默认情况下将行索引相同的数据合并到一起
1 2 df1=pd.DataFrame(np.ones((2 ,4 )),index=['A' ,'B' ],columns=['a' ,'b' ,'c' ,'d' ]) df1
a
b
c
d
A
1.0
1.0
1.0
1.0
B
1.0
1.0
1.0
1.0
1 2 df2=pd.DataFrame(np.zeros((3 ,3 )),index=['A' ,'B' ,'C' ],columns=['x' ,'y' ,'z' ]) df2
x
y
z
A
0.0
0.0
0.0
B
0.0
0.0
0.0
C
0.0
0.0
0.0
a
b
c
d
x
y
z
A
1.0
1.0
1.0
1.0
0.0
0.0
0.0
B
1.0
1.0
1.0
1.0
0.0
0.0
0.0
1 2 df2=pd.DataFrame(np.zeros((3 ,3 )),index=['A' ,'B' ,'C' ],columns=['x' ,'y' ,'z' ]) df2
x
y
z
A
0.0
0.0
0.0
B
0.0
0.0
0.0
C
0.0
0.0
0.0
a
b
c
d
x
y
z
A
1.0
1.0
1.0
1.0
0.0
0.0
0.0
B
1.0
1.0
1.0
1.0
0.0
0.0
0.0
x
y
z
a
b
c
d
A
0.0
0.0
0.0
1.0
1.0
1.0
1.0
B
0.0
0.0
0.0
1.0
1.0
1.0
1.0
C
0.0
0.0
0.0
NaN
NaN
NaN
NaN
数据合并之merge
merge:按照指定的列把数据按照一定的方式合并到一起
1 2 df3=pd.DataFrame(np.zeros((3 ,3 )),columns=['f' ,'a' ,'x' ]) df3
f
a
x
0
0.0
0.0
0.0
1
0.0
0.0
0.0
2
0.0
0.0
0.0
1 2 df3.loc[1 ,'a' ]=1 df1.merge(df3,on='a' )
a
b
c
d
f
x
0
1.0
1.0
1.0
1.0
0.0
0.0
1
1.0
1.0
1.0
1.0
0.0
0.0
1 2 3 df3=pd.DataFrame(np.arange(9 ).reshape((3 ,3 )),columns=['f' ,'a' ,'x' ]) print (df3)df1.merge(df3,on='a' )
f a x
0 0 1 2
1 3 4 5
2 6 7 8
a
b
c
d
f
x
0
1.0
1.0
1.0
1.0
0
2
1
1.0
1.0
1.0
1.0
0
2
1 2 3 4 5 6 7 left = pd.DataFrame({'key' : ['K0' , 'K1' , 'K2' , 'K3' ], 'A' : ['A0' , 'A1' , 'A2' , 'A3' ], 'B' : ['B0' , 'B1' , 'B2' , 'B3' ]}) right = pd.DataFrame({'key' : ['K0' , 'K1' , 'K2' , 'K3' ], 'C' : ['C0' , 'C1' , 'C2' , 'C3' ], 'D' : ['D0' , 'D1' , 'D2' , 'D3' ]}) left
key
A
B
0
K0
A0
B0
1
K1
A1
B1
2
K2
A2
B2
3
K3
A3
B3
key
C
D
0
K0
C0
D0
1
K1
C1
D1
2
K2
C2
D2
3
K3
C3
D3
1 left.merge(right,on='key' )
key
A
B
C
D
0
K0
A0
B0
C0
D0
1
K1
A1
B1
C1
D1
2
K2
A2
B2
C2
D2
3
K3
A3
B3
C3
D3
1 2 3 4 5 6 7 8 9 left = pd.DataFrame({'key1' : ['K0' , 'K0' , 'K1' , 'K2' ], 'key2' : ['K0' , 'K1' , 'K0' , 'K1' ], 'A' : ['A0' , 'A1' , 'A2' , 'A3' ], 'B' : ['B0' , 'B1' , 'B2' , 'B3' ]}) right = pd.DataFrame({'key1' : ['K0' , 'K1' , 'K1' , 'K2' ], 'key2' : ['K0' , 'K0' , 'K0' , 'K0' ], 'C' : ['C0' , 'C1' , 'C2' , 'C3' ], 'D' : ['D0' , 'D1' , 'D2' , 'D3' ]}) left
key1
key2
A
B
0
K0
K0
A0
B0
1
K0
K1
A1
B1
2
K1
K0
A2
B2
3
K2
K1
A3
B3
key1
key2
C
D
0
K0
K0
C0
D0
1
K1
K0
C1
D1
2
K1
K0
C2
D2
3
K2
K0
C3
D3
1 2 left.merge(right,on=['key1' ,'key2' ],how='outer' )
key1
key2
A
B
C
D
0
K0
K0
A0
B0
C0
D0
1
K0
K1
A1
B1
NaN
NaN
2
K1
K0
A2
B2
C1
D1
3
K1
K0
A2
B2
C2
D2
4
K2
K1
A3
B3
NaN
NaN
5
K2
K0
NaN
NaN
C3
D3
1 left.merge(right,on=['key1' ,'key2' ],how='right' )
key1
key2
A
B
C
D
0
K0
K0
A0
B0
C0
D0
1
K1
K0
A2
B2
C1
D1
2
K1
K0
A2
B2
C2
D2
3
K2
K0
NaN
NaN
C3
D3
1 2 3 4 5 boys = pd.DataFrame({'k' : ['K0' , 'K1' , 'K2' ], 'age' : [1 , 2 , 3 ]}) girls = pd.DataFrame({'k' : ['K0' , 'K0' , 'K3' ], 'age' : [4 , 5 , 6 ]}) res = pd.merge(boys, girls, on='k' , suffixes=['_boy' , '_girl' ], how='inner' ) res
k
age_boy
age_girl
0
K0
1
4
1
K0
1
5
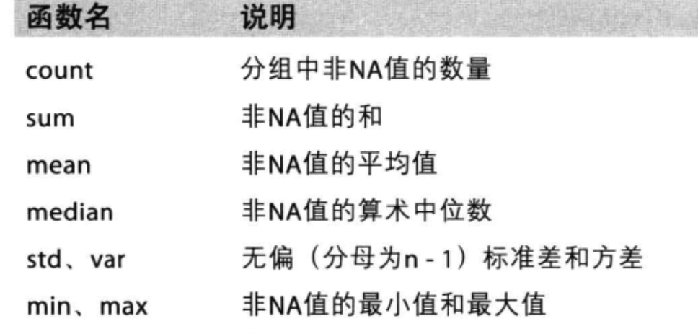
数据分组聚合
如果我想知道美国的星巴克数量和中国的哪个多,或者我想知道中国每个省份星巴克的数量的情况,
1 2 df=pd.read_csv('.\starbucks_store_worldwide.csv' ) df.head(1 )
Brand
Store Number
Store Name
Ownership Type
Street Address
City
State/Province
Country
Postcode
Phone Number
Timezone
Longitude
Latitude
0
Starbucks
47370-257954
Meritxell, 96
Licensed
Av. Meritxell, 96
Andorra la Vella
7
AD
AD500
376818720
GMT+1:00 Europe/Andorra
1.53
42.51
<class 'pandas.core.frame.DataFrame'>
RangeIndex: 25600 entries, 0 to 25599
Data columns (total 13 columns):
# Column Non-Null Count Dtype
--- ------ -------------- -----
0 Brand 25600 non-null object
1 Store Number 25600 non-null object
2 Store Name 25600 non-null object
3 Ownership Type 25600 non-null object
4 Street Address 25598 non-null object
5 City 25585 non-null object
6 State/Province 25600 non-null object
7 Country 25600 non-null object
8 Postcode 24078 non-null object
9 Phone Number 18739 non-null object
10 Timezone 25600 non-null object
11 Longitude 25599 non-null float64
12 Latitude 25599 non-null float64
dtypes: float64(2), object(11)
memory usage: 2.5+ MB
在pandas中类似的分组的操作我们有很简单的方式来完成
df.groupby(by=“columns_name”)
1 2 3 4 5 6 7 8 grouped=df.groupby(by="Country" ) type (grouped) grouped.count()[:2 ]
Brand
Store Number
Store Name
Ownership Type
Street Address
City
State/Province
Postcode
Phone Number
Timezone
Longitude
Latitude
Country
AD
1
1
1
1
1
1
1
1
1
1
1
1
AE
144
144
144
144
144
144
144
24
78
144
144
144
1 grouped["Country" ].count()[:3 ]
Country
AD 1
AE 144
AR 108
Name: Country, dtype: int64
1 2 3 country_count=grouped["Brand" ].count() print (country_count["US" ])country_count["CN" ]
13608
2734
1 2 3 4 china_data=df[df["Country" ]=="CN" ] grouped=china_data.groupby(by="State/Province" ).count()["Brand" ] grouped[:4 ]
State/Province
11 236
12 58
13 24
14 8
Name: Brand, dtype: int64
1 2 3 grouped = df["Brand" ].groupby(by=[df["Country" ],df["State/Province" ]]) print (grouped)
<pandas.core.groupby.generic.SeriesGroupBy object at 0x000001CA9031CF40>
1 2 3 4 5 6 t1 = df[["Country" ]].groupby(by=[df["Country" ],df["State/Province" ]]).count() t2 = df.groupby(by=["Country" ,"State/Province" ])[["Country" ]].count() print (type (t1),type (t2))t1.head()
<class 'pandas.core.frame.DataFrame'> <class 'pandas.core.frame.DataFrame'>
Country
Country
State/Province
AD
7
1
AE
AJ
2
AZ
48
DU
82
FU
2
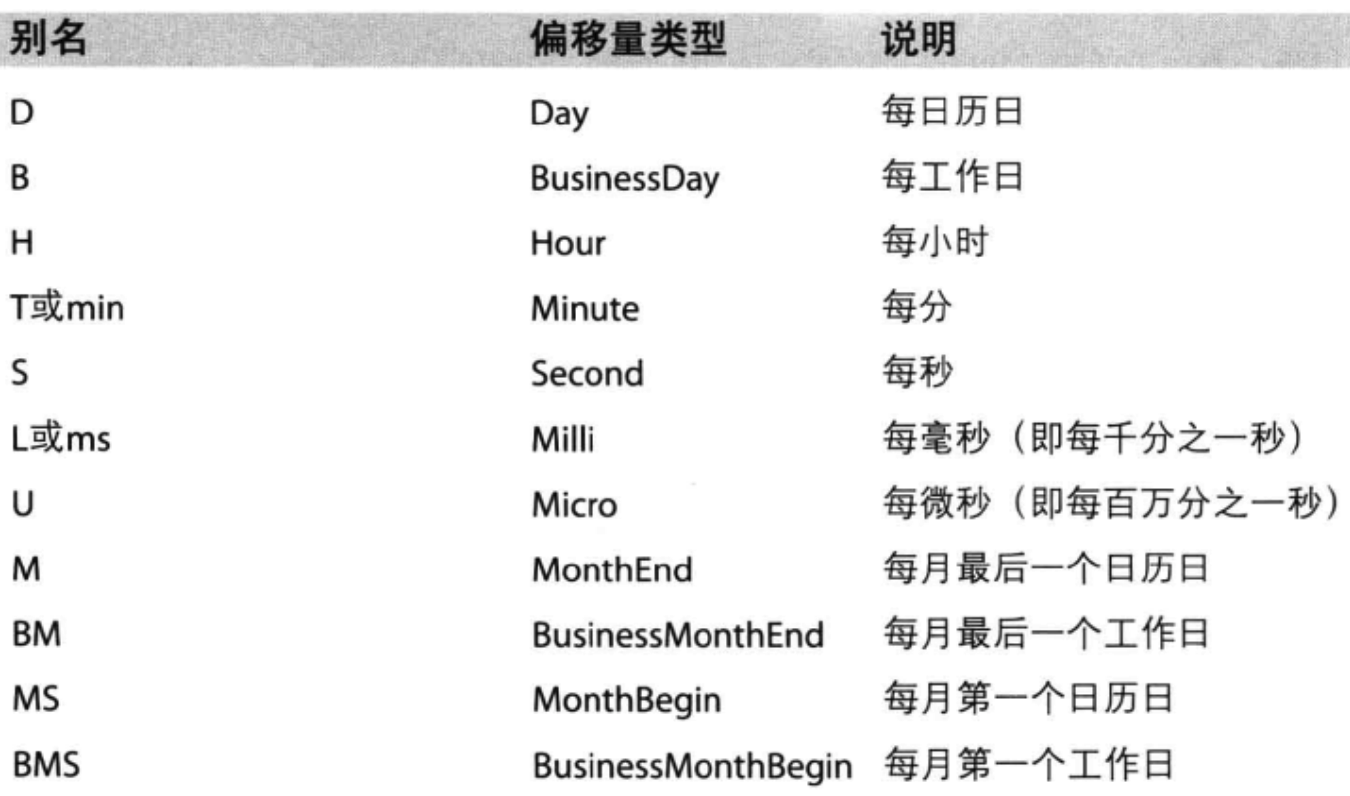
pandas时间序列
1 pd.date_range(start='20220101' ,end='20220227' ,freq='D' )
DatetimeIndex(['2022-01-01', '2022-01-02', '2022-01-03', '2022-01-04',
               '2022-01-05', '2022-01-06', '2022-01-07', '2022-01-08',
               '2022-01-09', '2022-01-10', '2022-01-11', '2022-01-12',
               '2022-01-13', '2022-01-14', '2022-01-15', '2022-01-16',
               '2022-01-17', '2022-01-18', '2022-01-19', '2022-01-20',
               '2022-01-21', '2022-01-22', '2022-01-23', '2022-01-24',
               '2022-01-25', '2022-01-26', '2022-01-27', '2022-01-28',
               '2022-01-29', '2022-01-30', '2022-01-31', '2022-02-01',
               '2022-02-02', '2022-02-03', '2022-02-04', '2022-02-05',
               '2022-02-06', '2022-02-07', '2022-02-08', '2022-02-09',
               '2022-02-10', '2022-02-11', '2022-02-12', '2022-02-13',
               '2022-02-14', '2022-02-15', '2022-02-16', '2022-02-17',
               '2022-02-18', '2022-02-19', '2022-02-20', '2022-02-21',
               '2022-02-22', '2022-02-23', '2022-02-24', '2022-02-25',
               '2022-02-26', '2022-02-27'],
              dtype='datetime64[ns]', freq='D')
我们可以使用pandas提供的方法把时间字符串转化为时间序列
df[“timeStamp”] = pd.to_datetime(df[“timeStamp”],format=“”)
format参数大部分情况下可以不用写,但是对于pandas无法格式化的时间字符串,我们可以使用该参数,比如包含中文
1 pd.date_range(start='20220101' ,end='20220227' ,freq='10D' )
DatetimeIndex(['2022-01-01', '2022-01-11', '2022-01-21', '2022-01-31',
               '2022-02-10', '2022-02-20'],
              dtype='datetime64[ns]', freq='10D')